
Order Flow At Its Best
The Composite Man's Flow Dynamics™ Indicator Suite
for ATAS® Charting/Trading Platform
Built Natively for ATAS®
Written in C# from ground up, a suite without compromise with clear, clutter-free renders.
No Repainting
NOTHING is generated with 'lookbacks' because 'nothing' is created at all - only amplified!
No Approximations
All calculations are based on tick-level bids and asks, providing traders with utmost precision.
Pure Footprint Data
Oder flow data without getting down to the footprint level - not losing sight of the big picture.
What is Flow Dynamics™ Indicator Suite?
A suite of six intricate indicators built for serious day/swing-traders who have volume at the center of their analysis.
Every single trader is taught that 'Price action is king' - it's not!
Price action is random - it's just a visual representation of people buying and selling an asset - without any predictive power!
Ditch the myths and start trading probabilities instead of predictions.
Flow Dynamics is your best bet to find high-probability setups - consistently!
Overview of the Flow Dynamics™ Indicator Suite
Find Where the Institutions
Left Their Fingerprints
Volumentum automatically detects and visualizes bid/ask imbalance clusters and absorption events on your ATAS charts with extremely customizable plotting options for maximum clarity — so you can focus on trading, not manually scanning every footprint candle and eventually losing sight of the big picture.
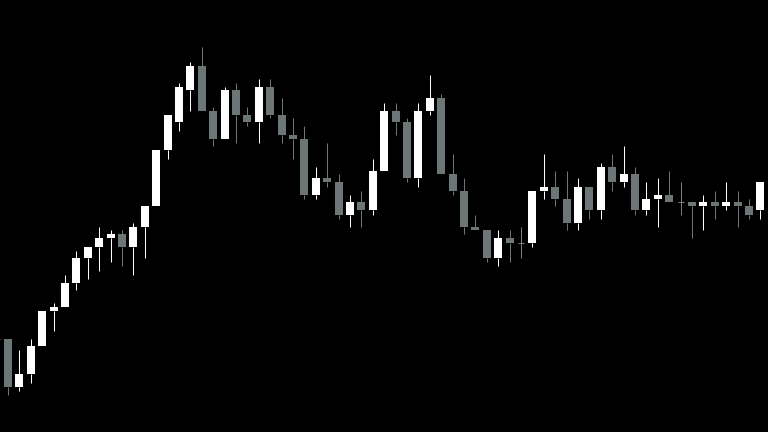
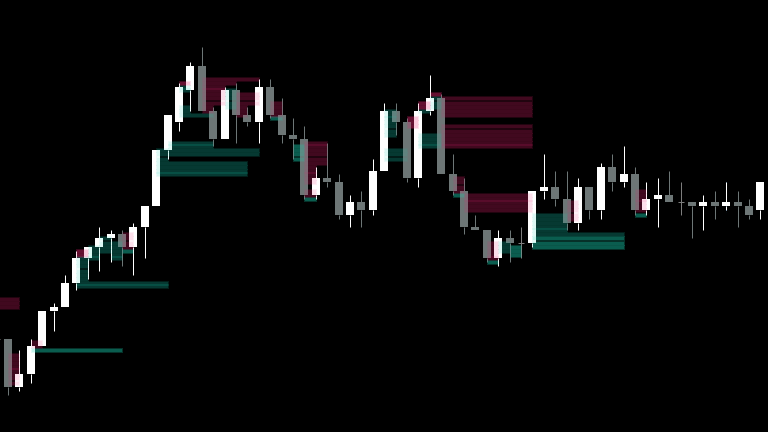
Every price move is driven by order flow. Somewhere in the tape, aggressive buyers or sellers overwhelmed the passive side — and they almost always do it in clusters. Volumentum finds those clusters.
• Scans every candle within your lookback window for bid/ask imbalances at the tick level
• Groups consecutive imbalance ticks into stacks — filtering out noise and highlighting genuine institutional activity
• Distinguishes between directional imbalances and absorption events with automatic color reclassification
• Tracks zone interactions — zones stop or disappear when price re-enters them, keeping your chart clean
• Dual detection pipeline: Horizontal (single-tick comparison) and Diagonal (cross-tick, traditional footprint method) — or both simultaneously
• Draggable start handle to set your scan range interactively without opening settings
Put the Charts
Under Microscope
Dominium is a zone-level order flow analyzer. Drop Dominium anywhere on your chart, resize it to cover desired price action range and instantly see the full bid/ask structure, dominant imbalances and volume statistics for everything inside Dominium. Simply dominate the chart with this powerful tool!
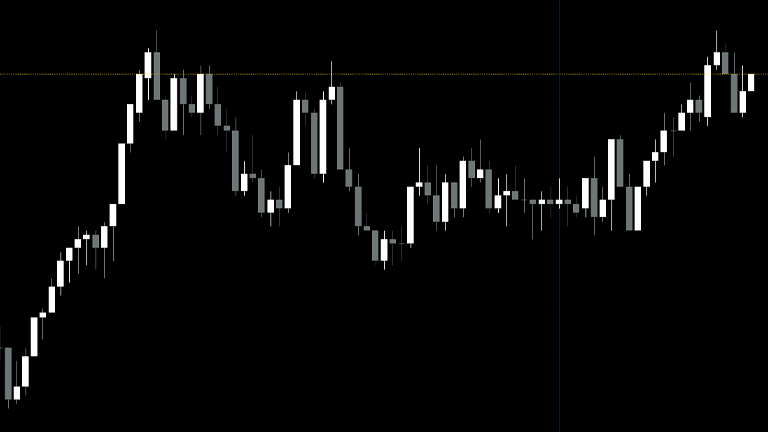
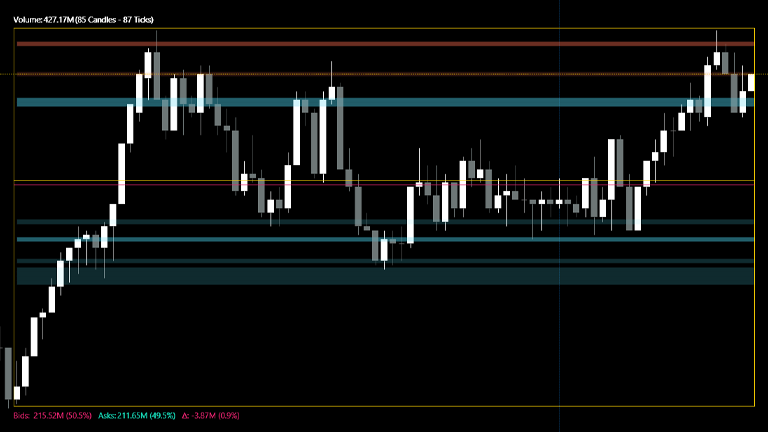
Price consolidates. Price breaks out. Price finds support. These are the 'whats'. The 'why' is always in the order flow — who was buying, who was selling, how much and at which prices. Dominium lets you answer those questions about any region of the chart in milliseconds - without leaving ATAS, without exporting data, without manual calculation.
• Fully interactive rectangle — drag to move, resize from any edge or corner
• Cumulative volume profile built from all bars inside the rectangle
• Imbalance detection across the aggregated profile (Diagonal, Horizontal, or both)
• Real-time statistics overlay: total volume, bids, asks, delta, candle count, tick count
• Minimum Touch Count filter: only show imbalances confirmed by multiple candles
• Optional aggregation: group ticks into bins for cleaner analysis of wide price ranges
• Live bar tracking: pin the right edge to the current bar and the rectangle auto-updates as the session progresses
• Absorption detection with color reclassification based on current live price
Ride the Waves
Spot the Divergences
Fluctus pairs a threshold-driven ZigZag pivot engine with an amazing divergence detection engine that matches price highs/lows to RSI and CVD highs/lows totally ignoring close-to-close approximations! The divergence engine also features two proprietary metrics (EFF and CRSM) that are totally lookback dependent and firing divergences much more reliable than those fired by RSI.
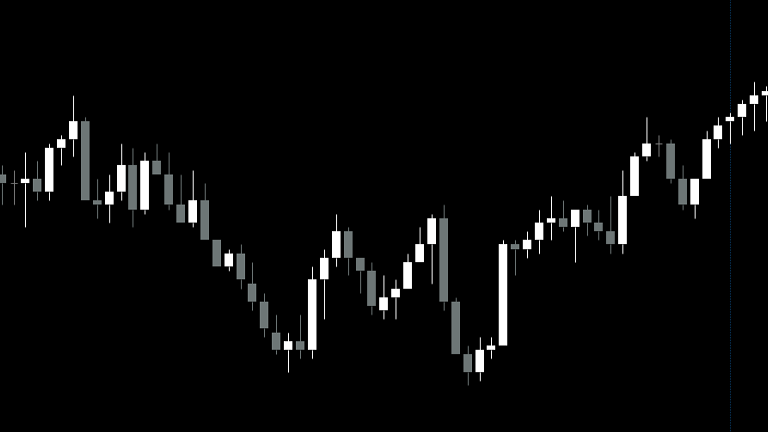
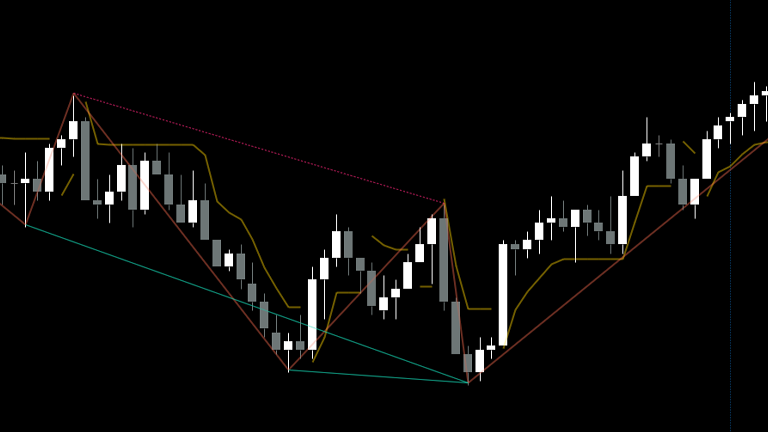
Composite Man's Fluctus is a multi-oscillator divergence detector built on top of a threshold-driven ZigZag pivot engine, with an integrated SuperTrend overlay. It identifies regular and hidden divergences between price pivots and your chosen oscillator — RSI, Stochastic, or the market's own cumulative volume delta (CVD) — and renders them as color-coded lines directly on your chart.
At its core, Fluctus answers one question on every bar: has momentum or order flow confirmed the latest swing, or is it quietly diverging from it? Divergences between price action and the underlying oscillator are among the most dependable early warnings of trend exhaustion and continuation — but spotting them manually across shifting pivot structures is tedious and error-prone. This indicator takes care of both sides: it defines the pivots objectively using a user-set percentage threshold, then evaluates every meaningful pair of same-type pivots within a rolling 3-pivot window.
Read the Tape
Hunt the Whales
Balena will show every significant single-order sweep clearly marked on your chart - in real time and historically — sized and classified by magnitude. Six levels - one clear visual language - clear as night and day.
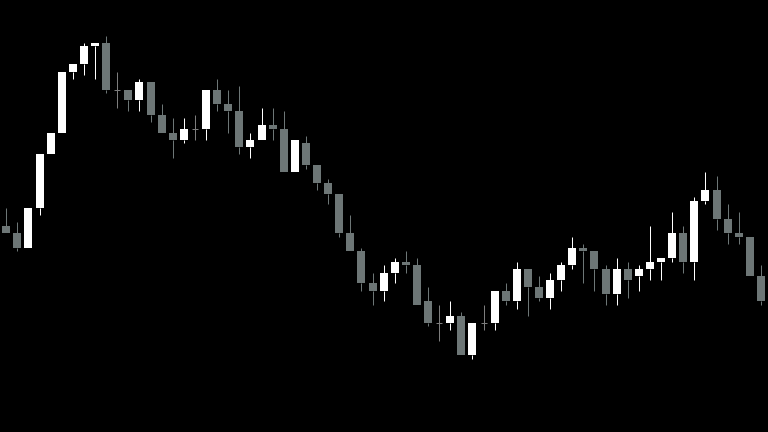
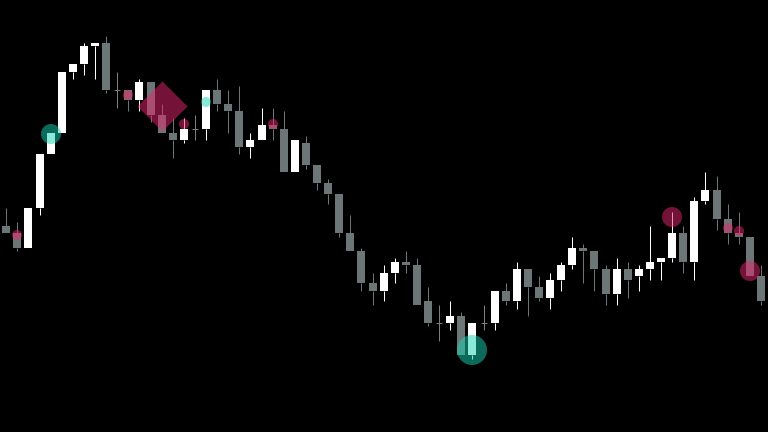
Most order flow tools aggregate data — they show you what happened at a price level across many orders. Balena does something fundamentally different: it tracks each individual aggressive order from first fill to last, measures the complete sweep volume, and classifies it against a chart-calibrated baseline. You’re not seeing accumulated activity. You’re seeing one decision, made by one participant, at a specific price and time - showing the footprint of institutional intent. A large orders doesn't happen by accident. It happens because someone with conviction and capital decided that price was worth acting on. Balena makes sure you see it.
• Full historical coverage — marks every qualifying large order from the oldest loaded bar to the present, not just live trades going forward
• Four baseline options: Chart Average, 90th Percentile, 95th Percentile, 98th Percentile — calibrate to your instrument and session
• Six magnitude levels with proportionally scaled circle markers for levels 1–5 and a distinct diamond for level 6
• Markers plotted at the exact entry price of the aggressor — tick-precise, not approximated to candle high/low
• User-defined multiplier and level increment for precise threshold control
• Separate buy and sell colors — direction is always immediately visible
• Live real-time updates as new sweeps print, with in-progress orders tracked as they extend across price levels
Everything. All at Once.
One Indicator to Bind Them All.
Most traders run three, four, five separate oscillator panels. RSI in one pane, Stochastic in another, Connors RSI somewhere else. Each one telling a fragment of the story. You glance between them. You miss things. You should not have to.
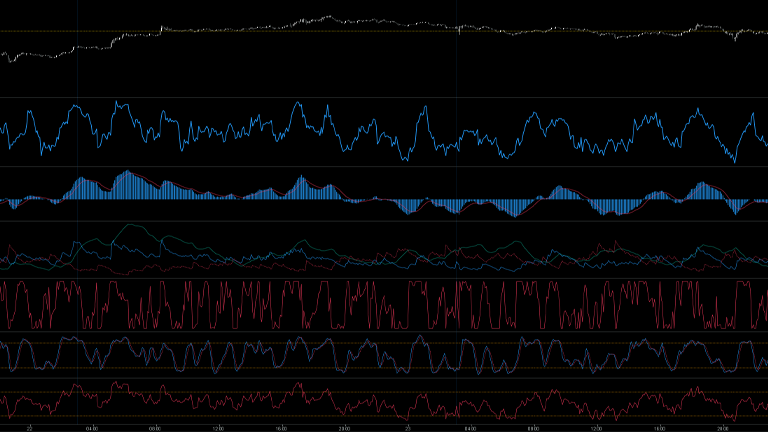
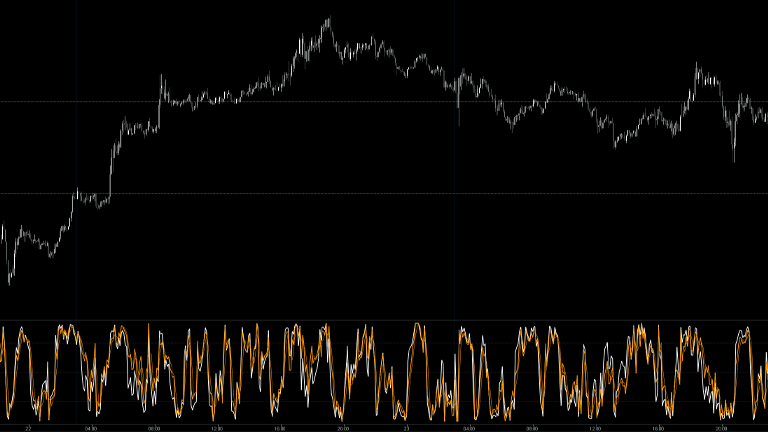
Omnia houses seven precision oscillators in a single panel — Chande Momentum Oscillator, Connors RSI, RSI, Stochastic, Stochastic RSI, Money Flow Index, and True Strength Index — each independently configurable, each independently plottable.
Above all seven indicators sits MASH; a weighted composite engine that blends any combination of those seven oscillators into a single normalized signal you control completely. Turn oscillators in or out of the composite by adjusting their weight. Layer the ones you want to see raw. MASH absorbs the rest. One panel. Everything.
The Only Squiggly Lines
You'll Ever Need
Strata replaces five separate MA indicators with a single, unified tool — giving you up to five fully independent moving averages, each with its own type, period, source, color, and thickness. Simple concept. Massive convenience.
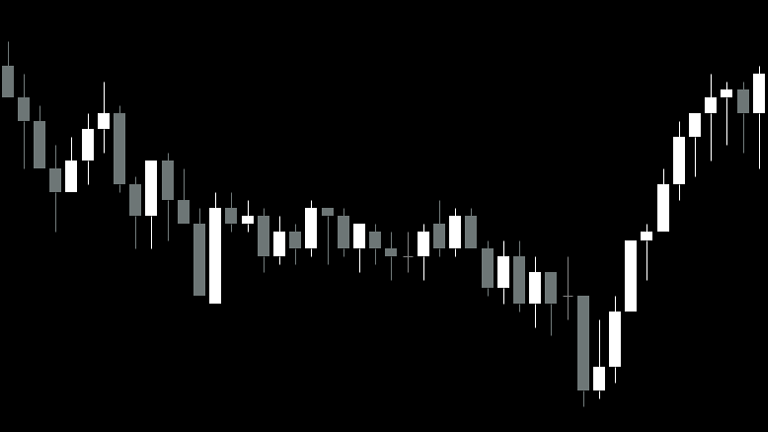
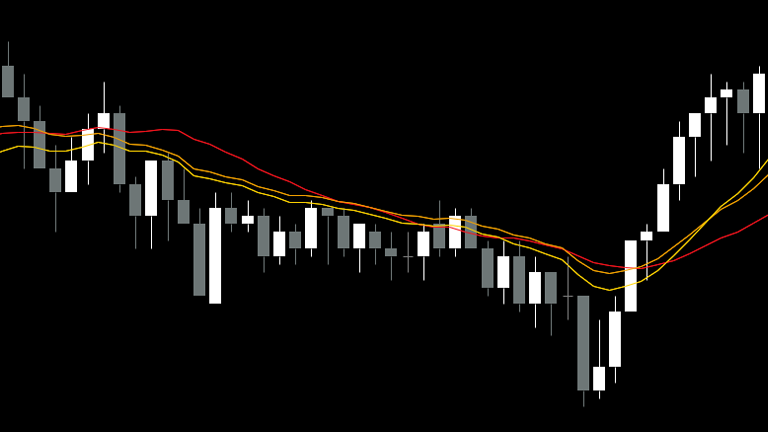
If you use multiple MAs — and you should — the standard approach means adding an indicator for each one. Five MAs means five separate entries in your indicator panel, five separate settings windows to open when you want to adjust something, and five separate potential sources of chart clutter. Strata collapses all of that into a single, clean, elegantly organized settings panel. One indicator. Up to five MAs. Done.
Who needs Strata?
• Traders who already use multiple MAs and are tired of managing them separately
• Anyone who wants to experiment with MA source mixing (e.g., VWMA vs EMA on the same period) without chart chaos
• Traders who value a clean, organized chart where every indicator serves a purpose
• New order flow traders who want to keep a trend context layer without adding complexity
Subscribe to Flow Dynamics™ Indicator Suite
Better Yet, Buy It Now & Make It Yours Forever
Try before you buy.
Full functionality for 7 days!
Smart traders don't commit without testing first.
We encourage you to try the Composite Man's Flow Dynamics Indicator Suite risk-free for 7 days to see how it transforms your workflow.
Commit to a plan only if it clicks for you.
Click the button below to request a free trial.
We'll whitelist your ATAS username for 7-days and send you the download/install instructions.
Already a fan? Great!
Choose a subscription to move forward or better yet, buy it and make it yours forever!
Pay monthly. Enjoy flexibility.
Cancel anytime.
Enjoy maximum flexibility with our monthly plan—perfect for testing the Composite Man's Flow Dynamics Indicator Suite. Cancel anytime if it doesn't fit your workflow.
You'll never be affected by future price increases and continue to receive all updates and potential additions to the suite as long as you remain subscribed.
Flexible Payment Options - Including Apple Pay, Google Pay, Klarna, Affirm & MORE Where Available
Cancel anytime.
Our annual plan offers better value than the monthly option, with payments renewed yearly. Cancel anytime—you'll keep full access to the indicator suite until the end of your billing period.
You'll never be affected by future price increases and continue to receive all updates and potential additions to the suite as long as you remain subscribed.
Flexible Payment Options - Including Apple Pay, Google Pay, Klarna, Affirm & MORE Where Available
One-time payment. Yours forever.
BEST VALUE!
Get the ultimate value with lifetime access to the Composite Man's Flow Dynamics Indicator Suite—follow in The Operator's footsteps forever!
Buy once, own it for life, with no worries about future price hikes or renewals.
You will receive all updates and potential additions to the suite for life!
Flexible Payment Options - Including Apple Pay, Google Pay, Klarna, Affirm & MORE Where Available
Frequently Asked Questions
Does Flow Dynamics™ Indicator Suite generate buy/sell signals?
No - definitely not. Flow Dynamics™ Indicator Suite is based on data analysis, not random shape/icon/flag generation.
Depending on indicator-generated buy/sell signals is them is no different than depending on Santa for Christmas presents.
If you wanna know more about signal generating indicators how they can ruin your life, head to our YouTube channel!
Is Flow Dynamics™ Indicator Suite exclusive to ATAS®?
Yes. Flow Dynamics™ Indicator Suite is written in C# exclusively for ATAS trading/charting platform and will NOT work on any other platform.
For TradingView, we have a different product named 'Market Mechanics™ Indicator Suite' which can be found on the respective section of the webpage - make sure you check that out too.
Does Flow Dynamics™ Indicator Suite work with ATAS X?
Yes. Flow Dynamics™ Indicator Suite works with ALL versions of ATAS - including the new ATAS X Beta.
We're continuously working on all indicators to make that the users never have to deal with compatibility issues.
Do I have to subscribe to the whole indicator suite?
Yes. The indicator suite is offered as a whole and subscribing to individual indicators is not an option.
Since the whole suite is priced as if it was a single indicator, this shouldn't be a problem.
Is there a free-trial?
There sure is - and we encourage you to use it before making a commitment. The fully functioning suite is available for you to evaluate for 7 days.
Scroll up and see the free trial tab in the subscription options.
Do the indicators "re-paint"?
No! We are allergic to re-painting indicators.
What instruments does the indicator suite work best with?
Indicators that rely on footprint data (Volumentum, Dominium) and cumulative trade data (Balena) require tick-level data — standard OHLCV data is not sufficient — which is the reason Flow Dynamics is not offered for TradingView. ALL instruments that are 'chartable' on ATAS provide bid/ask volume per tick so, the indicators will work flawlessly on every instrument.