
Markets Analysis at Its Best
The Composite Man's Market Mechanics™ Indicator Suite
for TradingView® Charting/Trading Platform
Built Natively for TradingView®
Written from ground up, a suite without compromise with clear, clutter-free renders.
No Repainting
NOTHING is generated with 'lookbacks' because 'nothing' is 'generated' at all - only made visible for you to see!
No Approximations
Extremely customizable calculations, providing traders with utmost precision.
Pure Data Analysis
Trade with clear, immediate data analysis without losing sight of the big picture.
What is Market Mechanics™ Indicator Suite?
A suite of six professional TradingView® indicators built for serious traders who want to see exactly what's happening in the markets!
In order to know where an asset is going, you need to know where it's coming from. Price action is random - it's just a visual representation of people buying and selling an asset - without any predictive power!
Ditch the myths and start trading probabilities instead of predictions.
Market Mechanics is your best bet to find high-probability setups - consistently!
Overview of the Market Mechanics™ Indicator Suite
The Crown Jewel of
Market Mechanics™ Indicator Suite
Curator is a professional-grade relative performance indicator for TradingView to answer two important questions: what's the markets doing and relative to everything else, how is my asset actually performing?
Curator is not a signal indicator. It does not generate buy or sell signals. It does not predict price. It surfaces objective, factual relative performance data and presents it in the clearest possible form — so that you can make better-informed decisions with proper context.
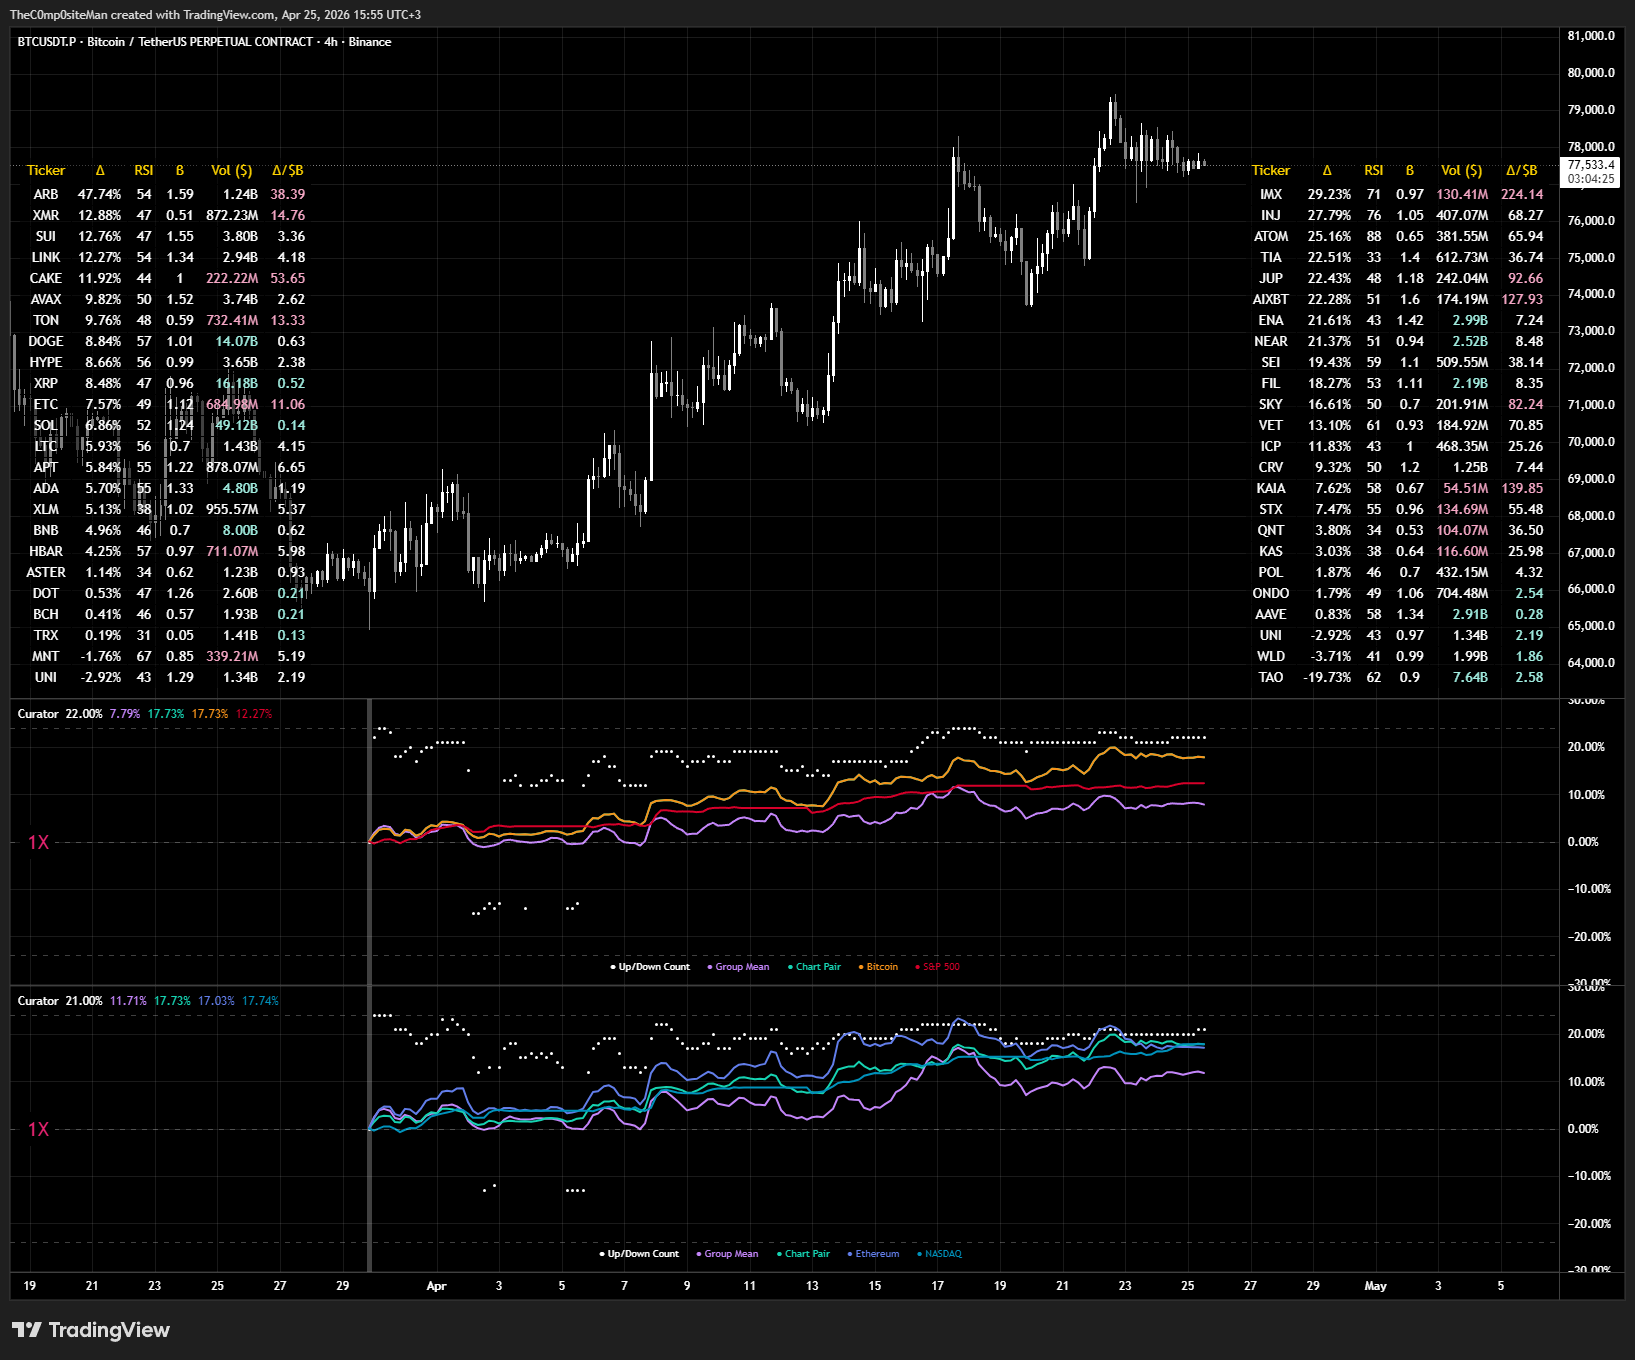
No asset exists in isolation. Now you’ll always know where yours stand.
Rather than showing you absolute price action in isolation, Curator normalizes all assets to a shared starting point and tracks their cumulative percentage change from there — simultaneously, on a single panel. Bitcoin, Ethereum, NASDAQ, S&P 500, your chart pair and up to 24 assets from your own custom watchlists — all rendered on the same scale, updated in real time.
Curator was built for traders who think in relative terms. If any of the following describes you, Curator belongs on your chart:
• You need to know instantly whether your asset is leading or lagging BTC, ETH, Others, S&P500, NASDAQ and the broader market.
• You practice relative strength analysis and need a multi-asset performance view that updates bar-by-bar.
• You want to measure performance over a specific date range — not from an arbitrary chart start.
• You track capital rotation and need to see different groups of assets dynamics at a glance.
• You run a watchlist of assets and want to see them ranked by period performance in a live table.
• You analyze group behavior — how correlated, how volatile, how synchronized the market is right now.
• You want to compare crypto to equities or equities to crypto (Bitcoin, Ethereum, Others, NASDAQ, S&P500) on the same normalized scale.
Everything, All at Once
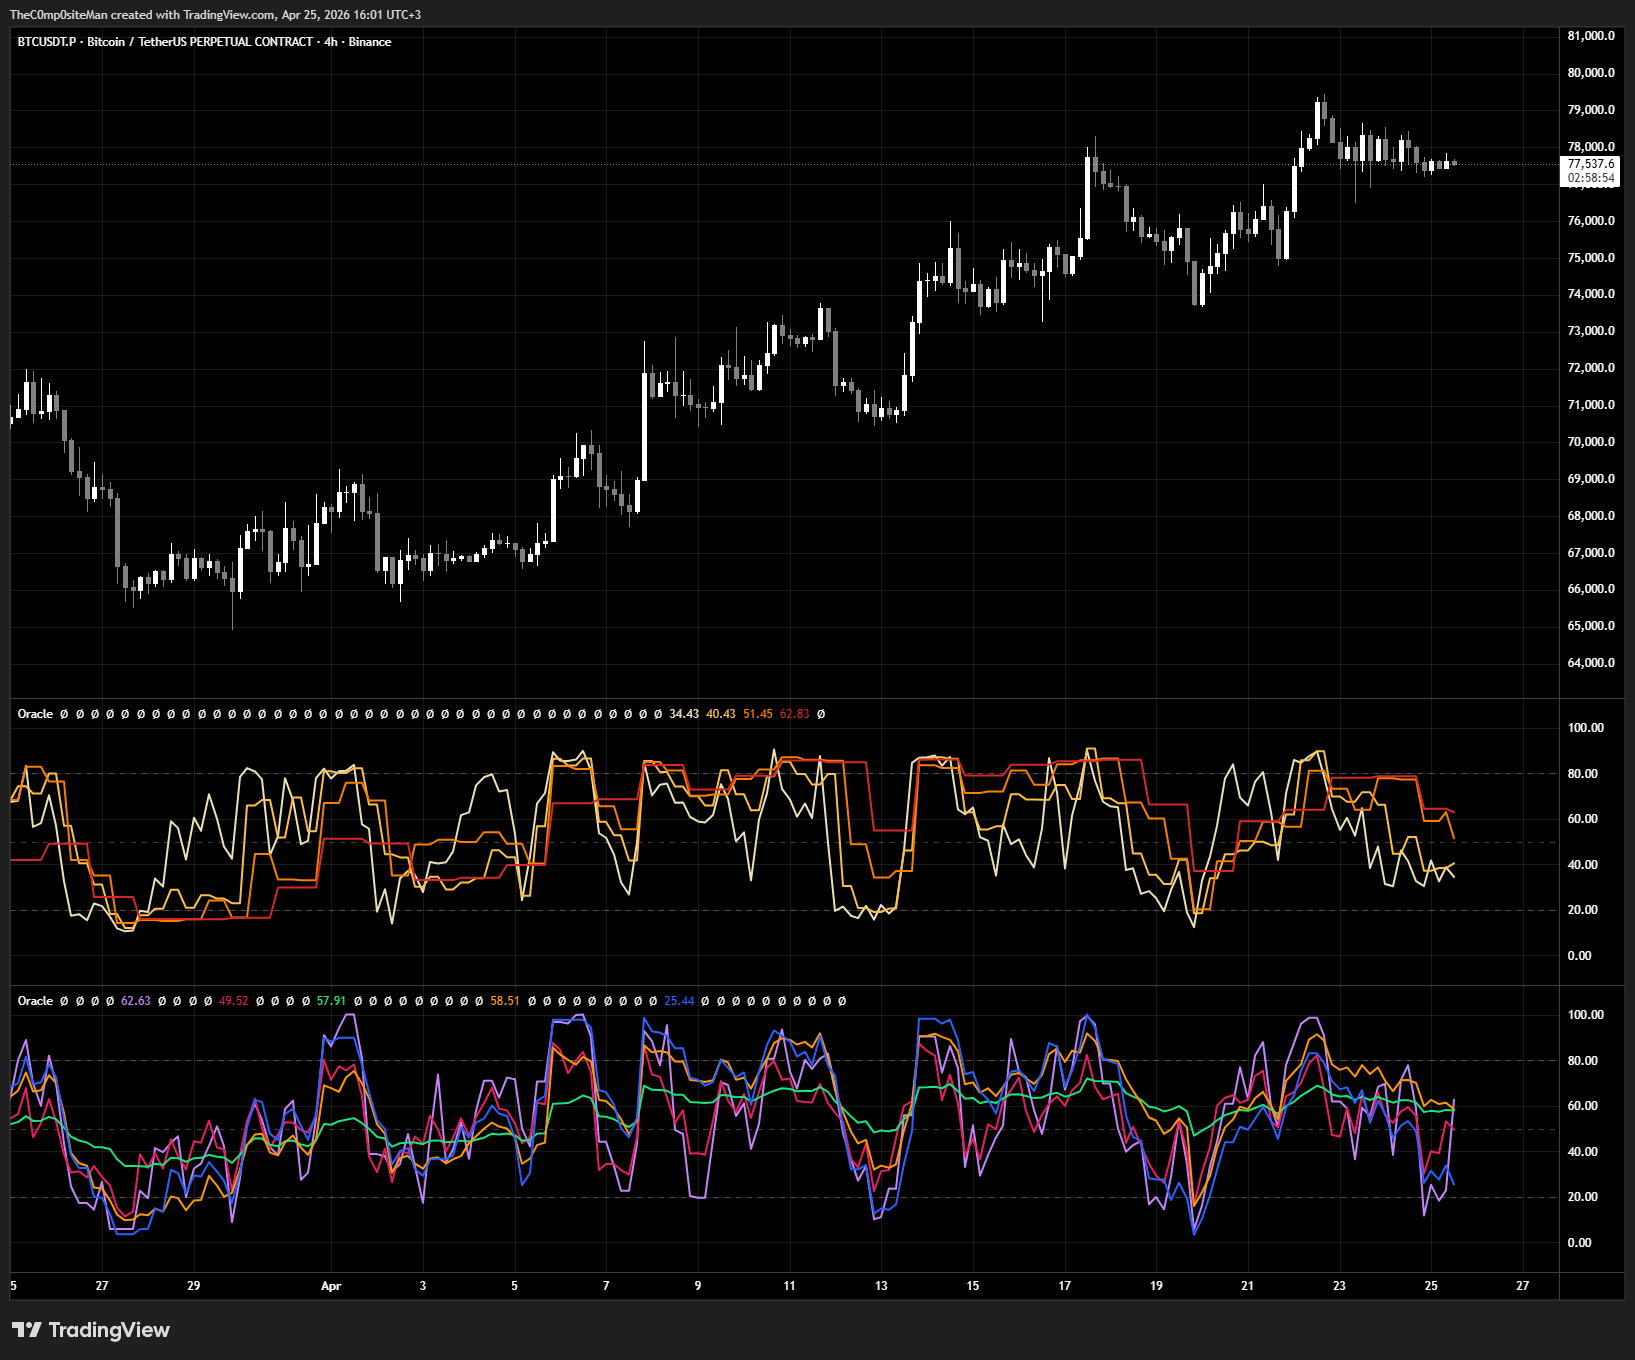
Most momentum indicators tell you one thing on one timeframe. Oracle computes five established momentum oscillators — Chande Momentum Oscillator, Connors RSI, Relative Strength Index, Stochastic, and Stochastic RSI — on four timeframes simultaneously. Every reading from every oscillator on every timeframe can be viewed individually, blended per-timeframe into a Mash-Up composite, and then compressed across all timeframes into a single Crunch line that represents the complete consensus view.
Talk about confluence!
Who Is Oracle For?
• Traders who use momentum oscillators but are tired of flipping between multiple indicators and timeframes.
• Analysts who want a single, consolidated momentum view across all relevant timeframes simultaneously.
• Quant-minded traders who want precise control over how much each oscillator contributes to the composite signal.
• Multi-timeframe traders who need TF agreement — not just TF1 momentum — before entering a position.
• Anyone who has ever thought: "All five of my oscillators on all four timeframes agree right now" — and wanted to see that consensus on one line.
Every Market Move
Begins & Ends at a Level
The levels were always there - now you'll see them in the clearest way possible with Level-II-Level - a professional-grade multi-timeframe key levels indicator for TradingView.
Built for traders who understand that price respects structure — and that knowing where the boundaries are is half the battle.
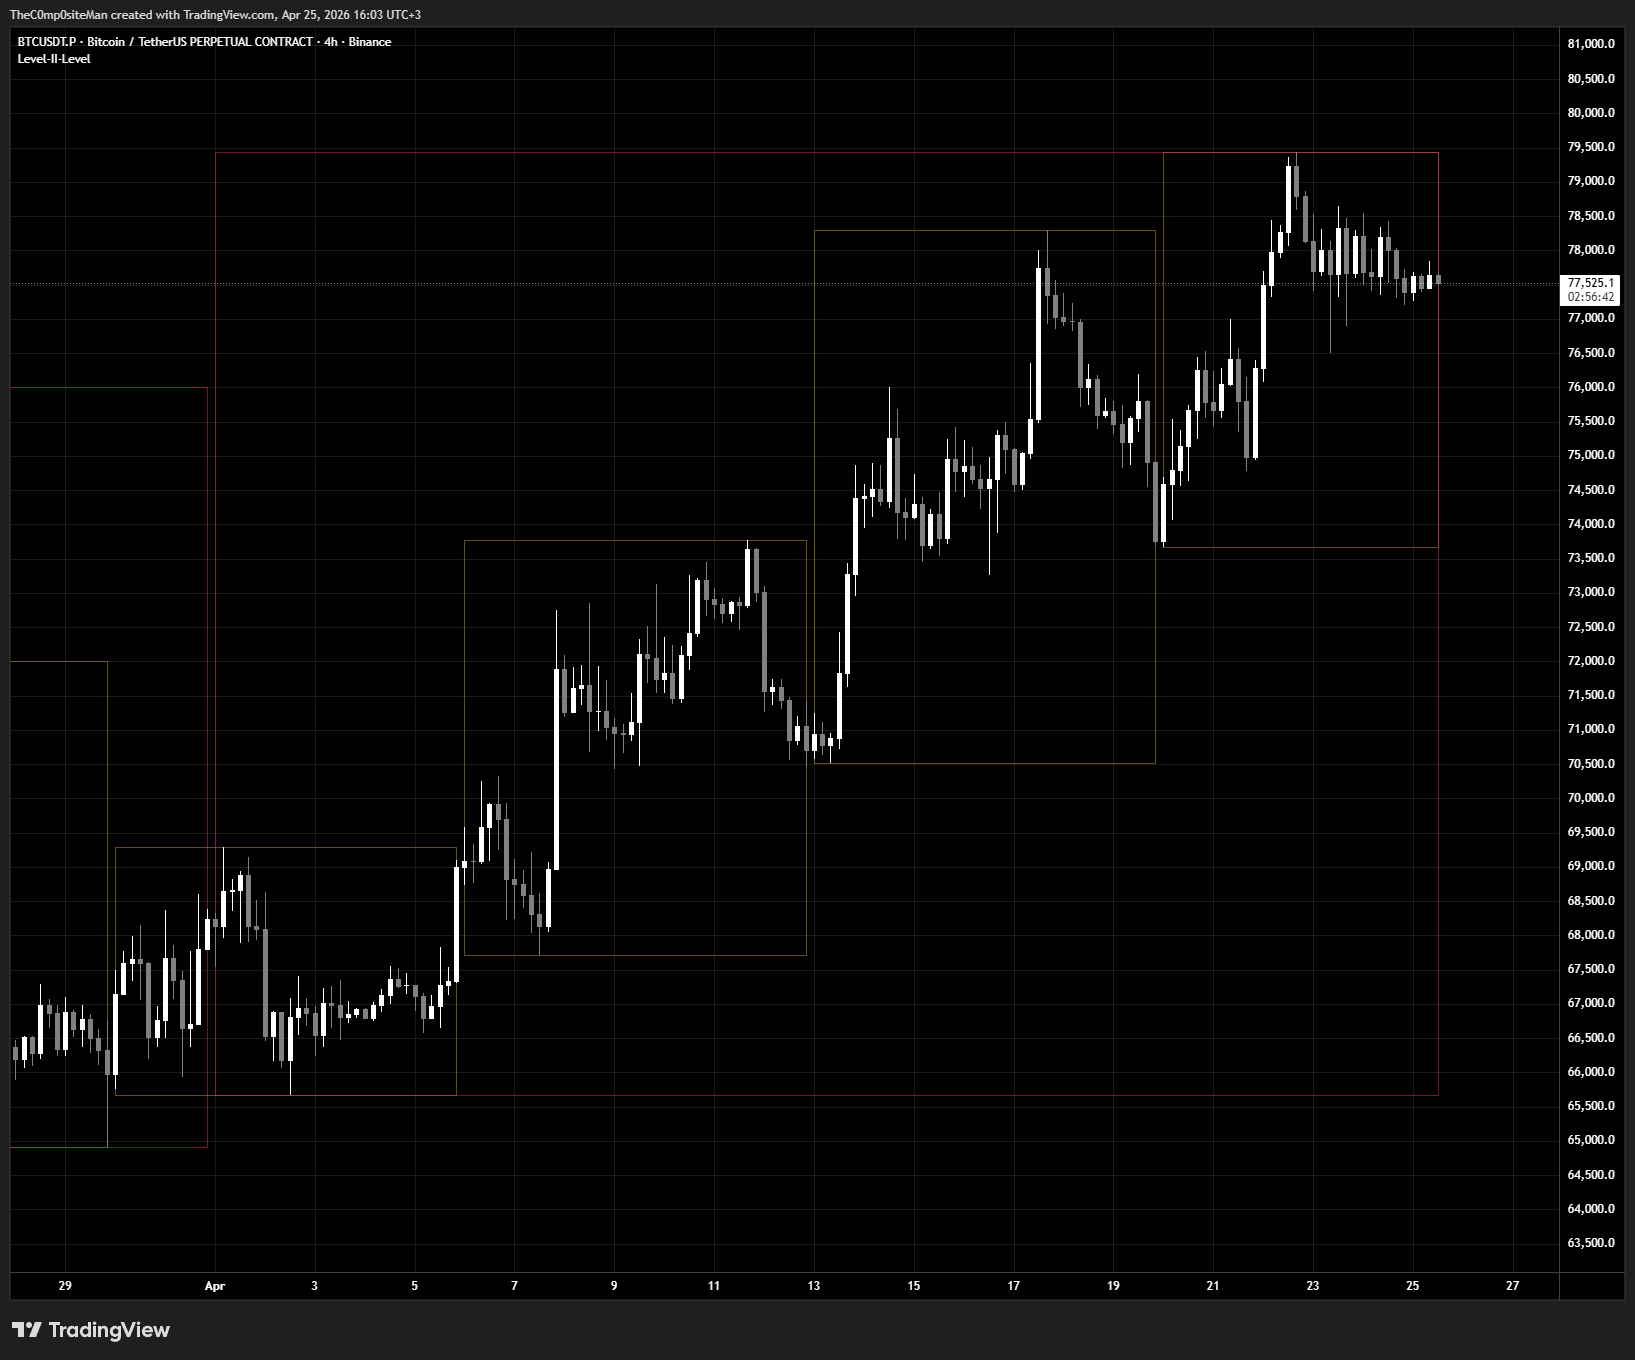
Level-II-Level is a precision overlay indicator for TradingView that plots the most important price levels across select timeframes simultaneously. These are not calculated levels - they are not derived from formulas or signals, they are the raw Open, High, and Low of every major timeframe — the exact prices that institutions, algorithms, and professional desks use to frame their risk and set their targets. Level-II-Level puts all of them on your chart, cleanly, in one place.
Price has memory. The high of last week, the open of this month, the low of last quarter — these are not arbitrary numbers. They are the prices at which large participants made decisions. Algorithms are programmed to react at these levels. Market makers set their books around them. Retail flows cluster near them. When price approaches a previous monthly high, something happens. When it opens a new week below the prior week's low, something happens. Level-II-Level ensures you are never caught unaware of where these gravitational points sit.
Map Structure. Confirm Momentum.
& Trail the Trend.
ZZ Div + ST is a professional-grade overlay indicator that combines a fully configurable ZigZag engine, a precision divergence detector, and a dual-timeframe SuperTrend — all rendered directly on your price chart, working together so you can focus on trading, not tool management.
Most traders juggle three or four separate indicators to do what ZZ Div + ST does on its own. You switch between a ZigZag for structure, an RSI-based divergence tool for confluence, and a SuperTrend for trend direction — all while trying to read a cluttered chart and make decisions in real time. ZZ Div + ST changes that.
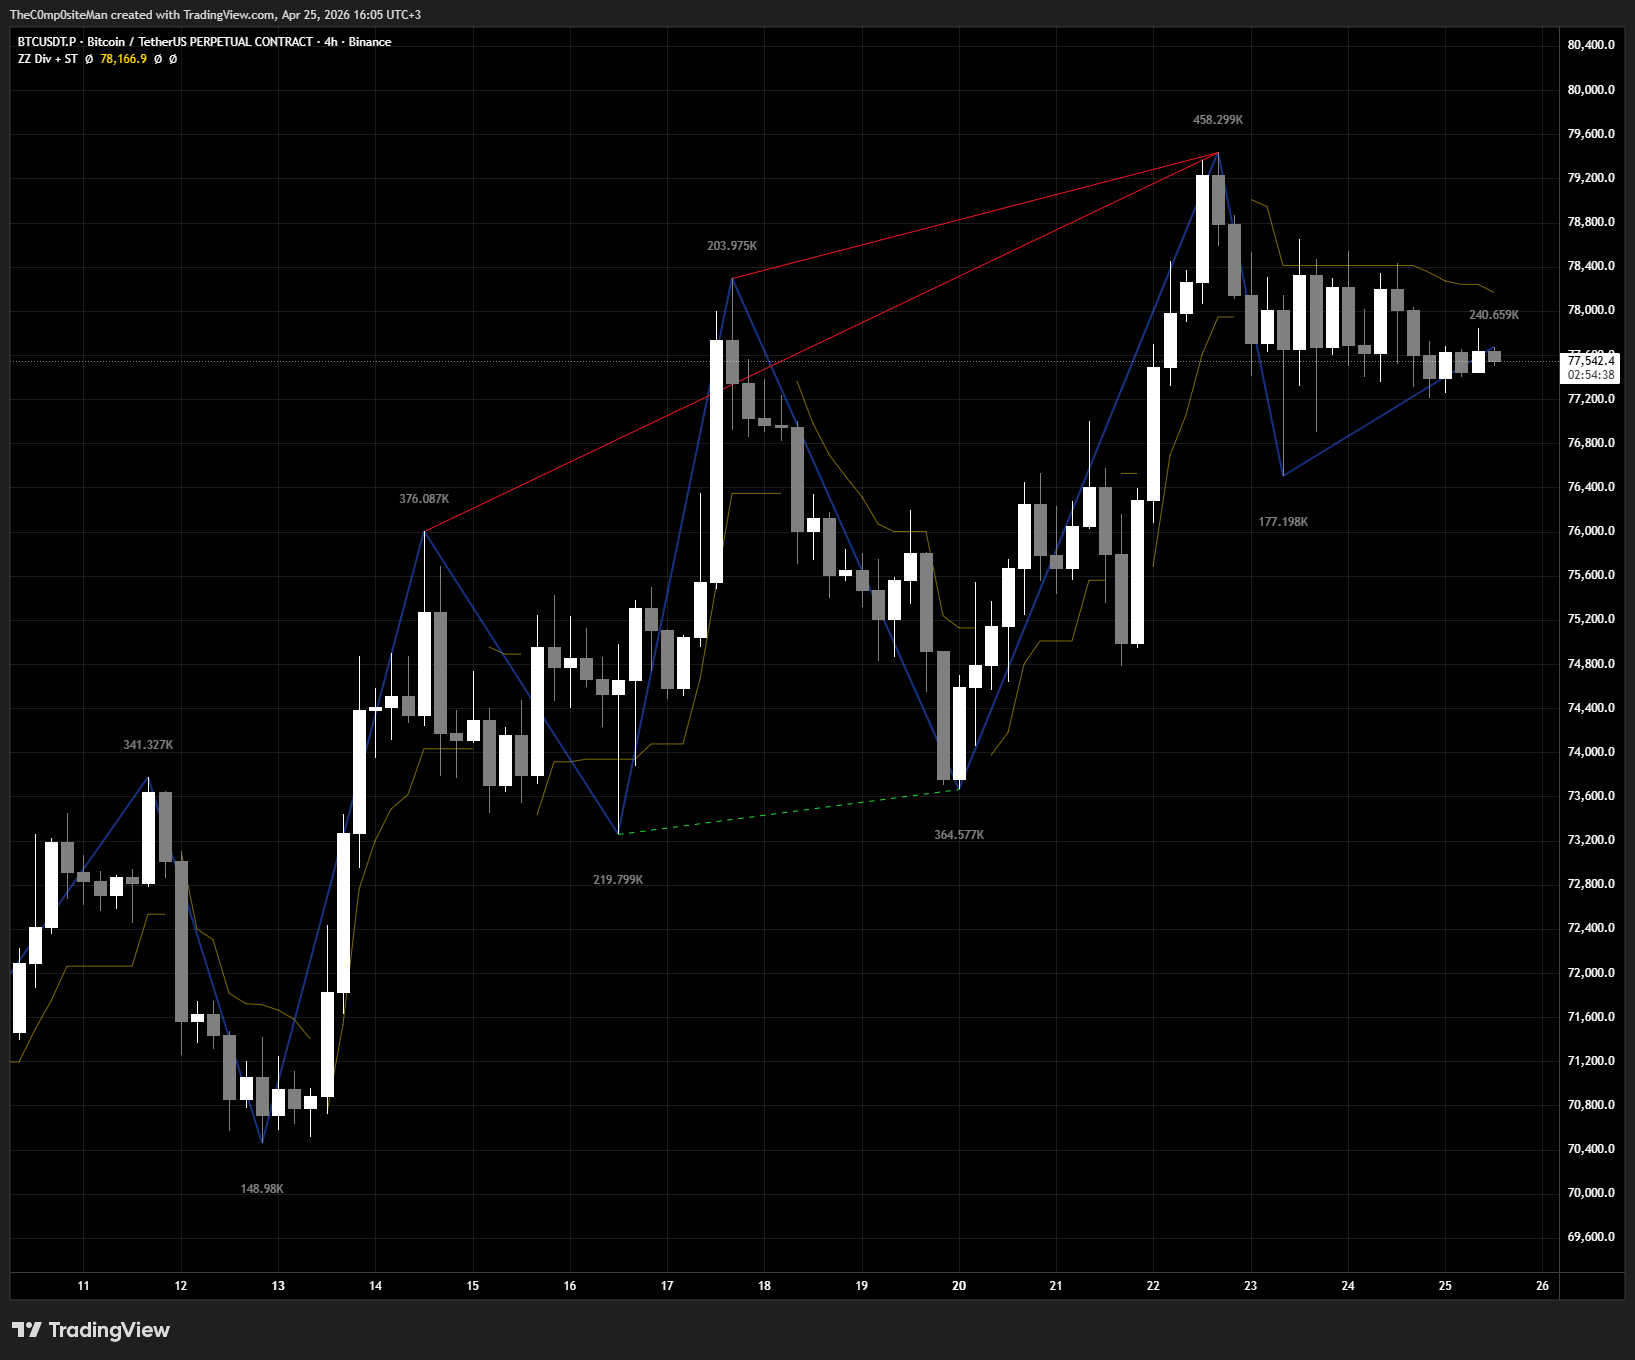
One chart, three engines, unlimited edge!
• One overlay, zero clutter — price structure, momentum confirmation, and trend direction on a single chart layer
• Works on any market: stocks, crypto, forex, futures, indices — anything TradingView supports
• Works on any timeframe: scalpers to position traders can dial in the sensitivity for their style
• Fully configurable — every parameter is accessible and labeled; no buried settings
• Built on Pine Script v6 with object-oriented architecture for performance and reliability
• No repainting on confirmed bars
Multi-Exchange. Multi-Market. One Signal.
Most CVD indicators tell half the story. They pull from a single exchange, ignore the futures market entirely, and hand you a number with no context for how accurate it is. You trust it. You should not. CVD Pro changes that!
CVD Pro is built different. It aggregates CVD across up to four futures exchanges and four spot exchanges simultaneously, at a precision timeframe you control — down to the second. It separates spot flow from futures flow, shows you where they agree, where they diverge and gives you a range-analysis table that quantifies everything in both absolute and percentage terms. It is the CVD tool that institutional desks would build for themselves — except someone already did it for you.
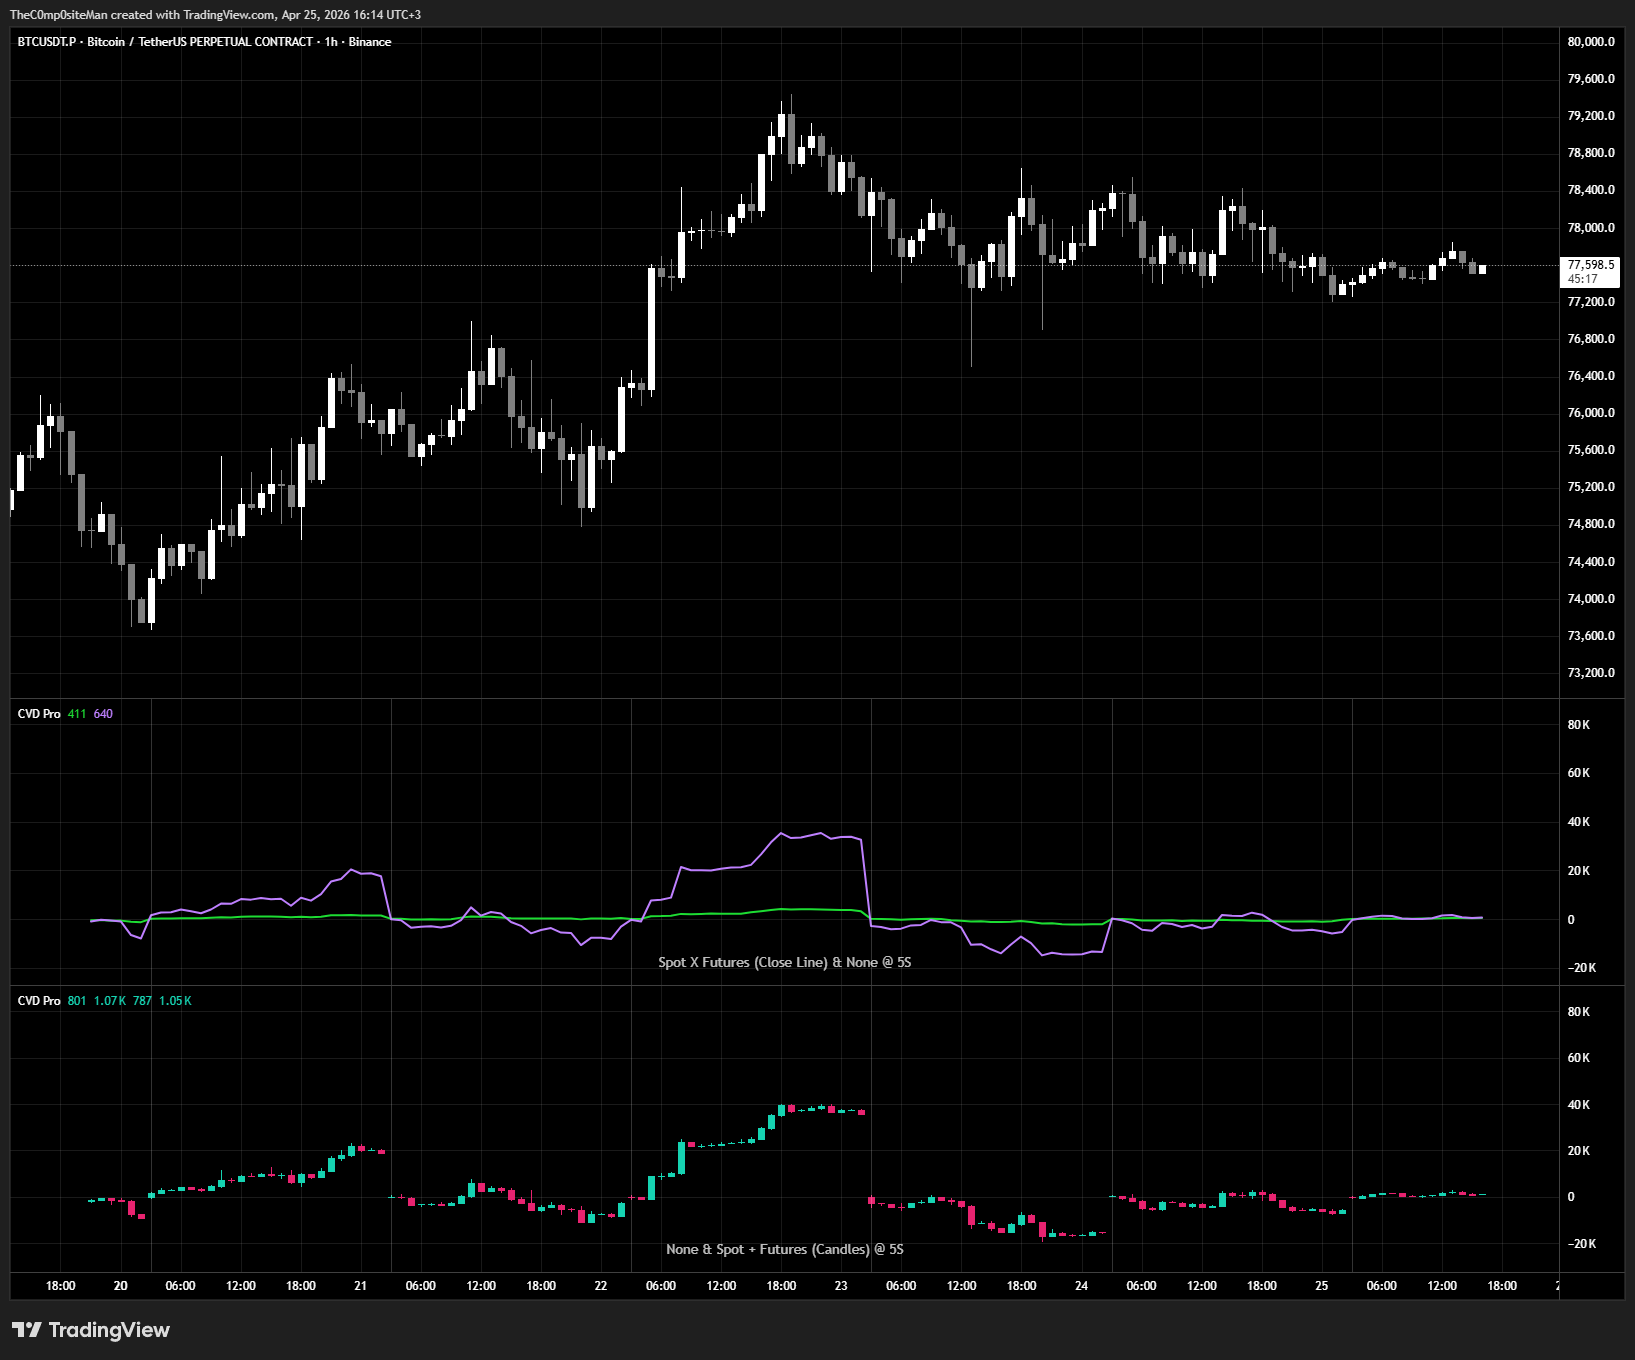
Eight exchanges funnel into six plot modes displayed in two simultaneous views. All with a click of a mouse in one single indicator!
CVD Pro aggregates real buy and sell volume pressure from up to eight sources simultaneously:
★ 4 Futures Exchanges (USDT Perpetuals)
★ 4 Spot Exchanges (USDT Pairs)
★ Per-exchange enable / disable toggles
★ Per-exchange force-plot individual lines
★ All-or-nothing validity gating
★ Aggregated Spot + Futures combined view
★ Spot X Futures side-by-side divergence
★ Chart ticker passthrough mode
The Last MA Toolkit You Will Ever Need
Most traders have been doing it wrong. They load a chart, drop one or two moving averages on it, and call it analysis. They pick a period because someone on the internet said so. They don't know what type of MA they're using, why it was designed, or whether it suits their market or timeframe.
MA Pro is built for traders who actually know — or want to know — the difference. It puts nineteen distinct moving average algorithms at your fingertips, across seven fully independent, individually configurable plots, each with its own type, period, source, timeframe, color, weight, and live label.
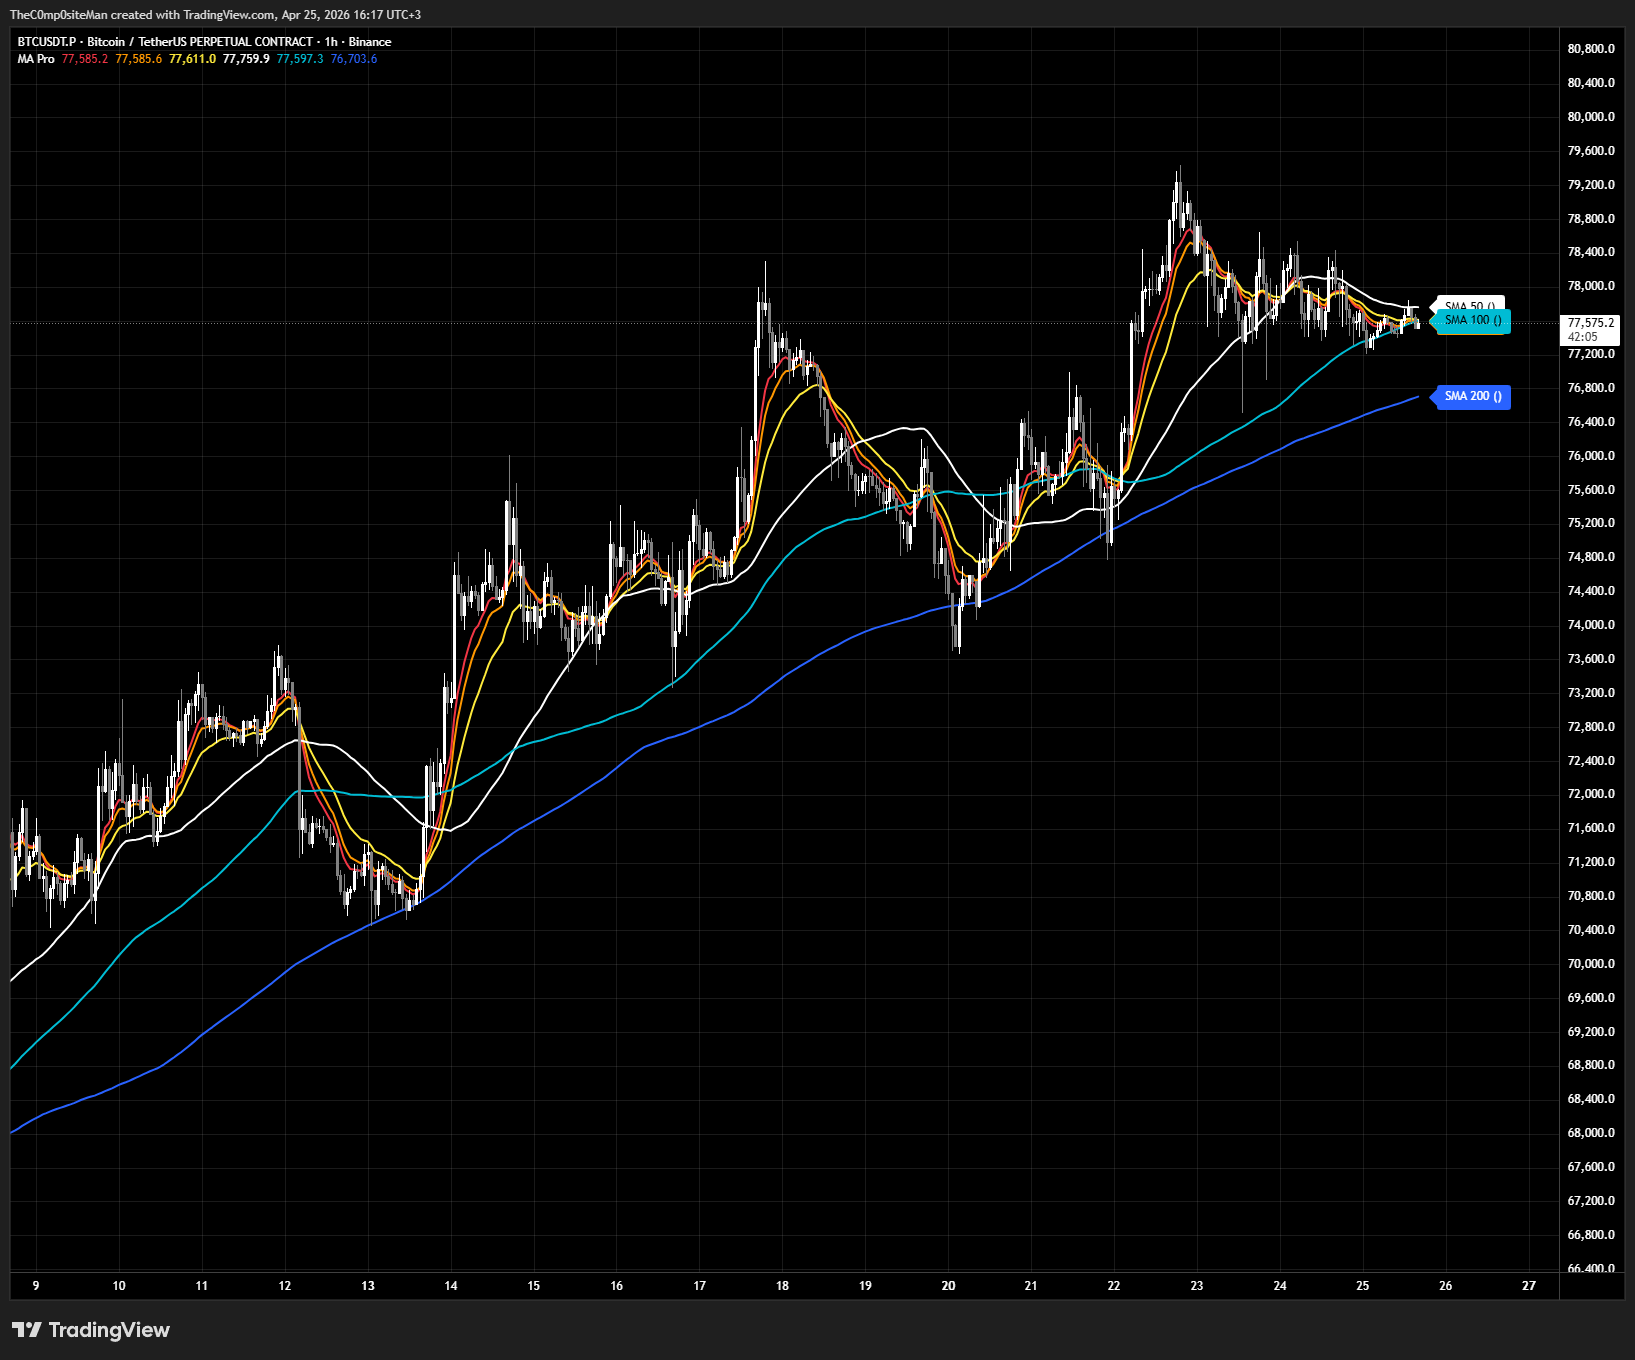
Nineteen(!) algorithms, seven plots, every timeframe, one indicator!
Subscribe to Market Mechanics™ Indicator Suite
Better Yet, Buy It Now & Make It Yours Forever
Try before you buy.
Full functionality for 7 days!
Smart traders don't commit without testing first.
We encourage you to try the Composite Man's Market Mechanics Indicator Suite risk-free for 7 days to see how it transforms your workflow.
Commit to a plan only if it clicks for you.
Click the button below to request a free trial.
We'll whitelist your TradingView username for 7-days and send you the download/install instructions.
Already a fan? Great!
Choose a subscription to move forward or better yet, buy it and make it yours forever!
Pay monthly. Enjoy flexibility.
Cancel anytime.
Enjoy maximum flexibility with our monthly plan—perfect for testing the Composite Man's Market Mechanics Indicator Suite. Cancel anytime if it doesn't fit your workflow.
You'll never be affected by future price increases and continue to receive all updates and potential additions to the suite as long as you remain subscribed.
Flexible Payment Options - Including Apple Pay, Google Pay, Klarna, Affirm & MORE Where Available
Pay annually. Save BIG!
Cancel anytime.
Our annual plan offers better value than the monthly option, with payments renewed yearly.
Cancel anytime—you'll keep full access to the indicator suite until the end of your billing period.
You'll never be affected by future price increases and continue to receive all updates and potential additions to the suite as long as you remain subscribed.
Flexible Payment Options - Including Apple Pay, Google Pay, Klarna, Affirm & MORE Where Available
One-time payment. Yours forever.
BEST VALUE!
Get the ultimate value with lifetime access to the Composite Man's Market Mechanics Indicator Suite—follow in The Operator's footsteps forever!
Buy once, own it for life, with no worries about future price hikes or renewals.
You will receive all updates and potential additions to the suite for life!
Flexible Payment Options - Including Apple Pay, Google Pay, Klarna, Affirm & MORE Where Available
Frequently Asked Questions
Does Market Mechanics™ Indicator Suite generate buy/sell signals?
No - definitely not. Market Mechanics™ Indicator Suite is based on data analysis, not random shape/icon/flag generation.
Depending on indicator-generated buy/sell signals is them is no different than depending on Santa for Christmas presents.
If you wanna know more about signal generating indicators how they can ruin your life, head to our YouTube channel!
Is Market Mechanics™ Indicator Suite exclusive to TradingView®?
Yes. Market Mechanics™ Indicator Suite is written in Pine Script v.6 exclusively for TradingView trading/charting platform and will NOT work on any other platform.
For ATAS, we have a different product named 'Flow Dynamics™ Indicator Suite' which can be found on the respective section of the webpage - make sure you check that out too.
Do I have to subscribe to the whole indicator suite?
Yes. The indicator suite is offered as a whole and subscribing to individual indicators is not an option.
Since the whole suite is priced as if it was a single indicator, this shouldn't be a problem.
Is there a free-trial?
There sure is - and we encourage you to use it before making a commitment. The fully functioning suite is available for you to evaluate for 7 days.
Scroll up and see the free trial tab in the subscription options.
Do the indicators "re-paint"?
No! We are allergic to re-painting indicators.
What instruments does the indicator suite work best with?
Indicators in the Market Mechanics Indicator Suite only rely on Open/High/Low/Close/Volume data and they will work flawlessly on every instrument available in TradingView - especially with cryptocurrencies where exchange provided data is more transparent compared to other assets.